

EMPOWERING ORGANIZATIONS
THROUGH DATA AND INFORMATION
Our Data Apps will allow communities and organizations to clean, organize and visualize their data. This is the beginning of a data revolution which will allow making informed and evidence-based decisions in contexts ranging from social activism, to industry and commerce.


OUR KICKSTARTER CAMPAIGN IS RIGHT AROUND THE CORNER!
To be the first one to donate to our project, please leave us your contact details.
Wha are we trying
to solve?
There are lots of data but people don't know what to do with it
Data for important issues is hard to find and communicate.
Current solutions are not accessible enough for non-tech users.
People do not easily embrace facts
“The ones who need information don’t have an easy access to it: from the manager of a multinational corporation to a city mayor who wants to install a traffic light. I wanted to conceive a way in which people could have quick answers based on data, based on facts. Usually, the developers of open code software don’t succeed in monetizing it. And it is important that those awesome weekend projects can become someone’s source of income.”
Juan Pablo Marín
CEO at Datasketch

What are our
features?
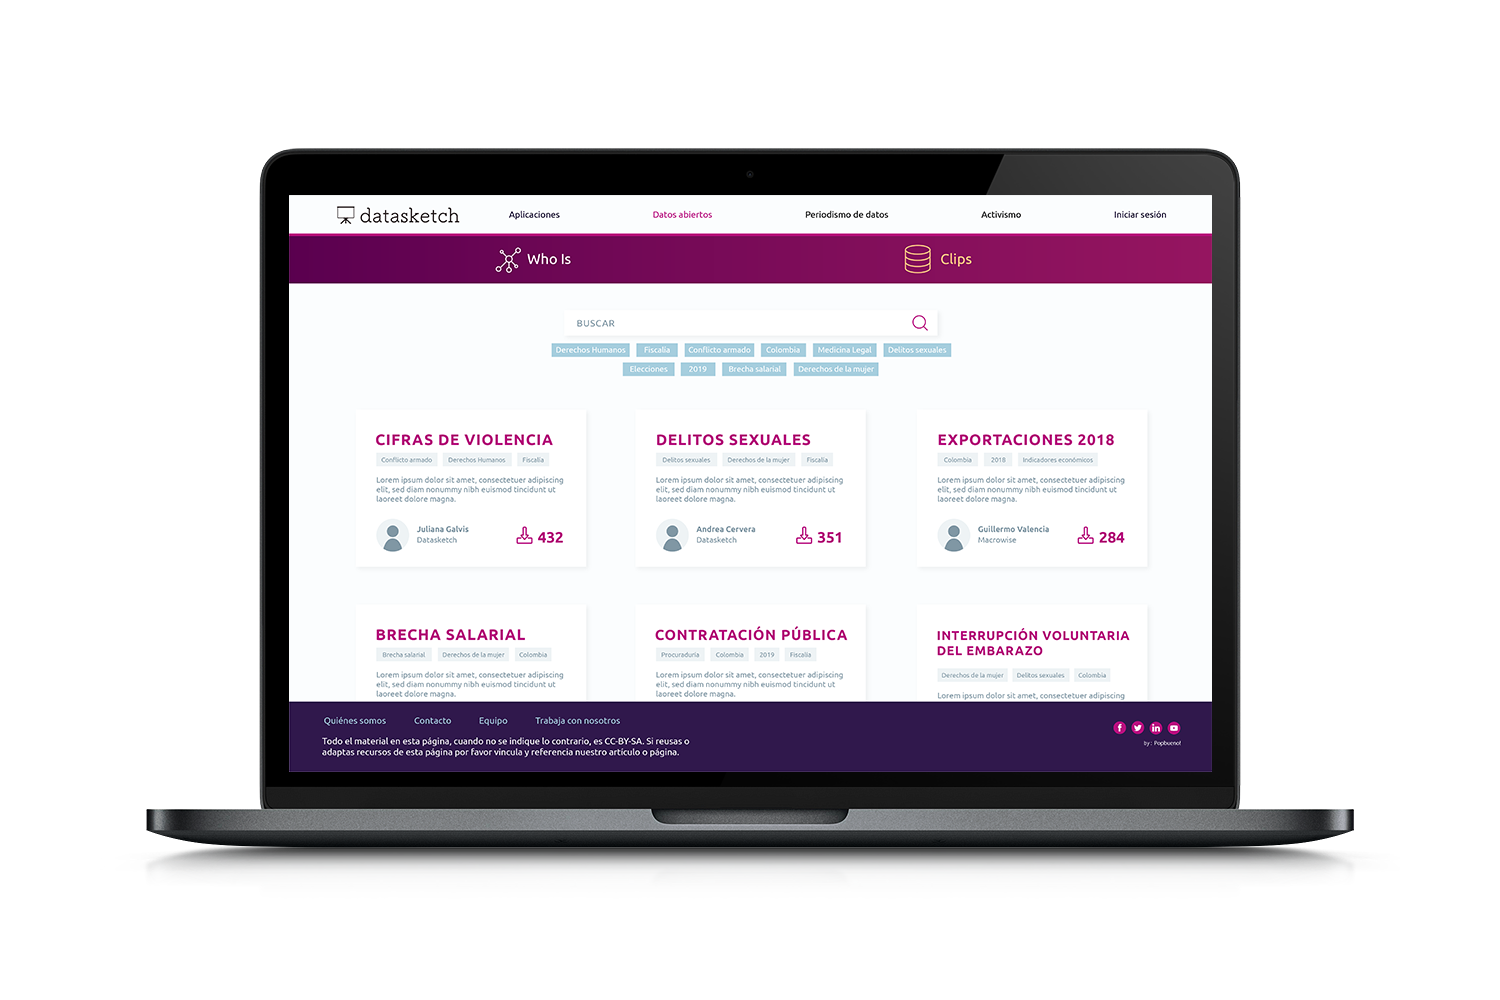
Access public databases and use them
There are a lot of sources of public data, but not all are accesible or have the right formats to use them. With our apps, find clean and tidy information from various sources, handpicked by experts from the Open Data community.
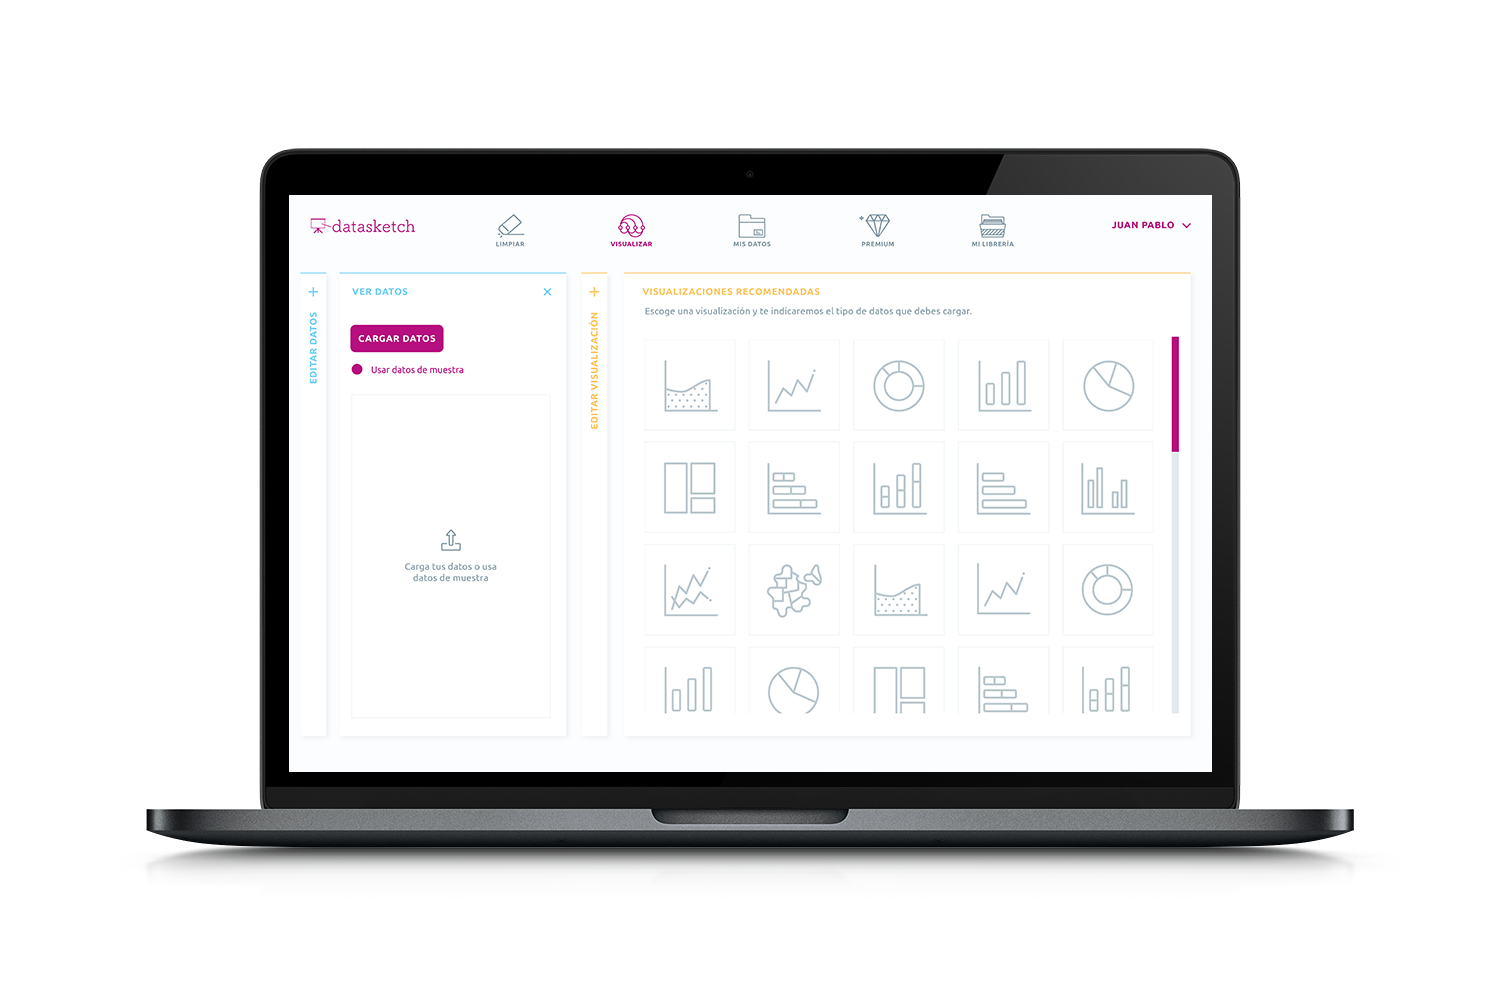
Learn while doing
With our AI powered data visualization solution, you learn while visualizing and analysing information. Our recommendation engine provides useful tips while guiding you through the process of extracting the most out of your data.
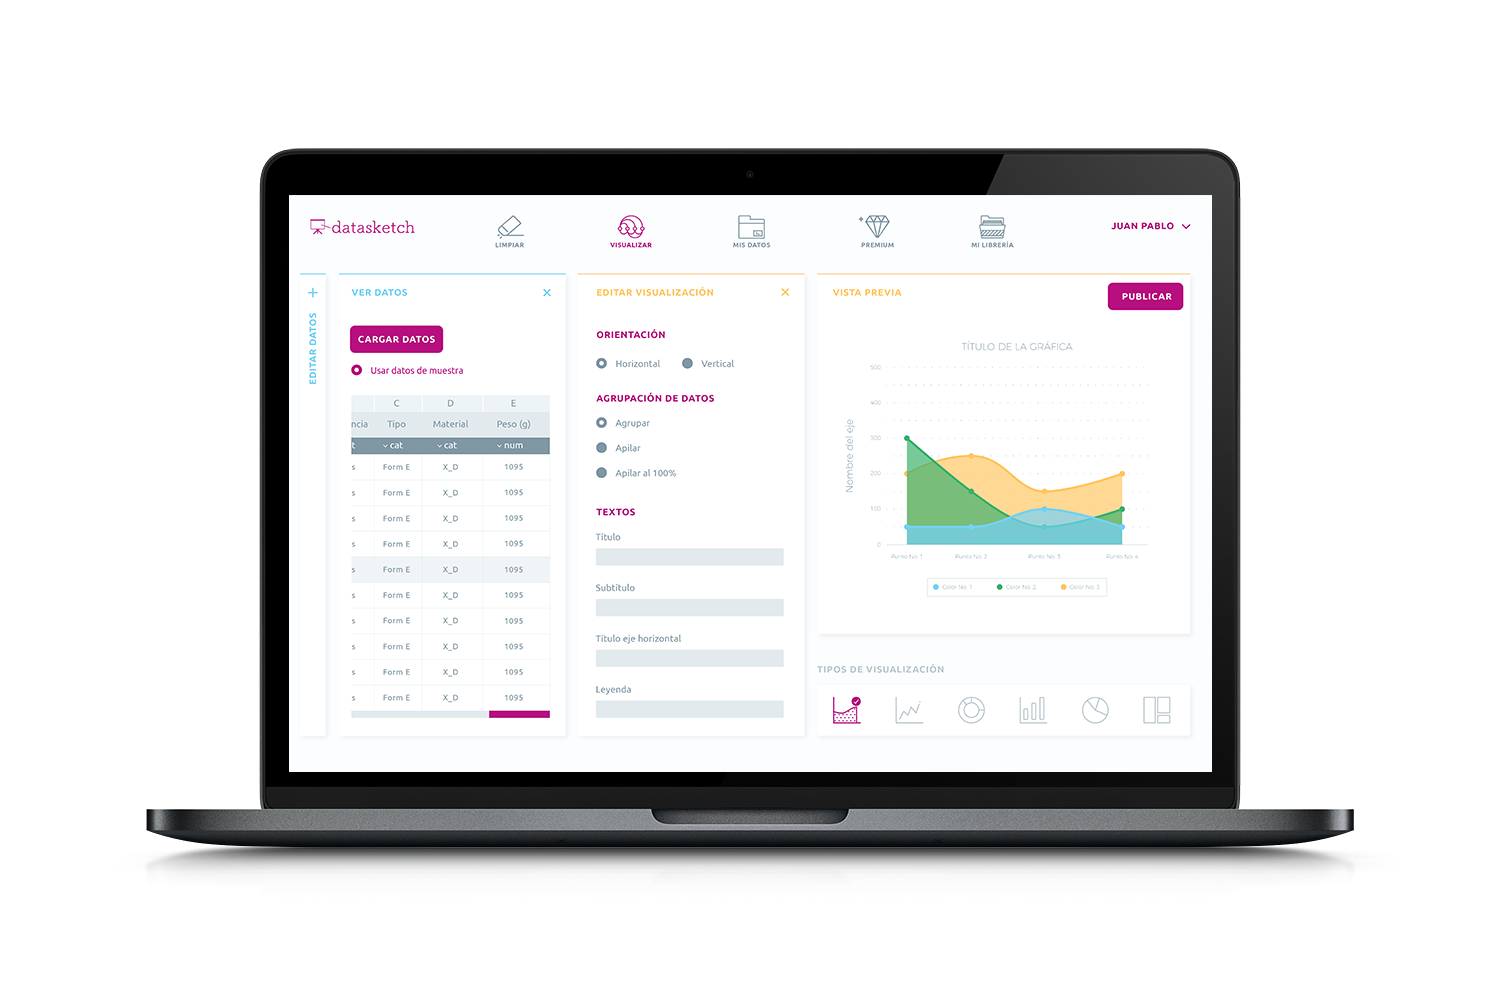
Visualiza data in seconds
You don’t need to be an expert in data visualization or analytics to get the answers you need. With a few clicks our tool allows you to easily communicate evidence-based facts in a matter of seconds.
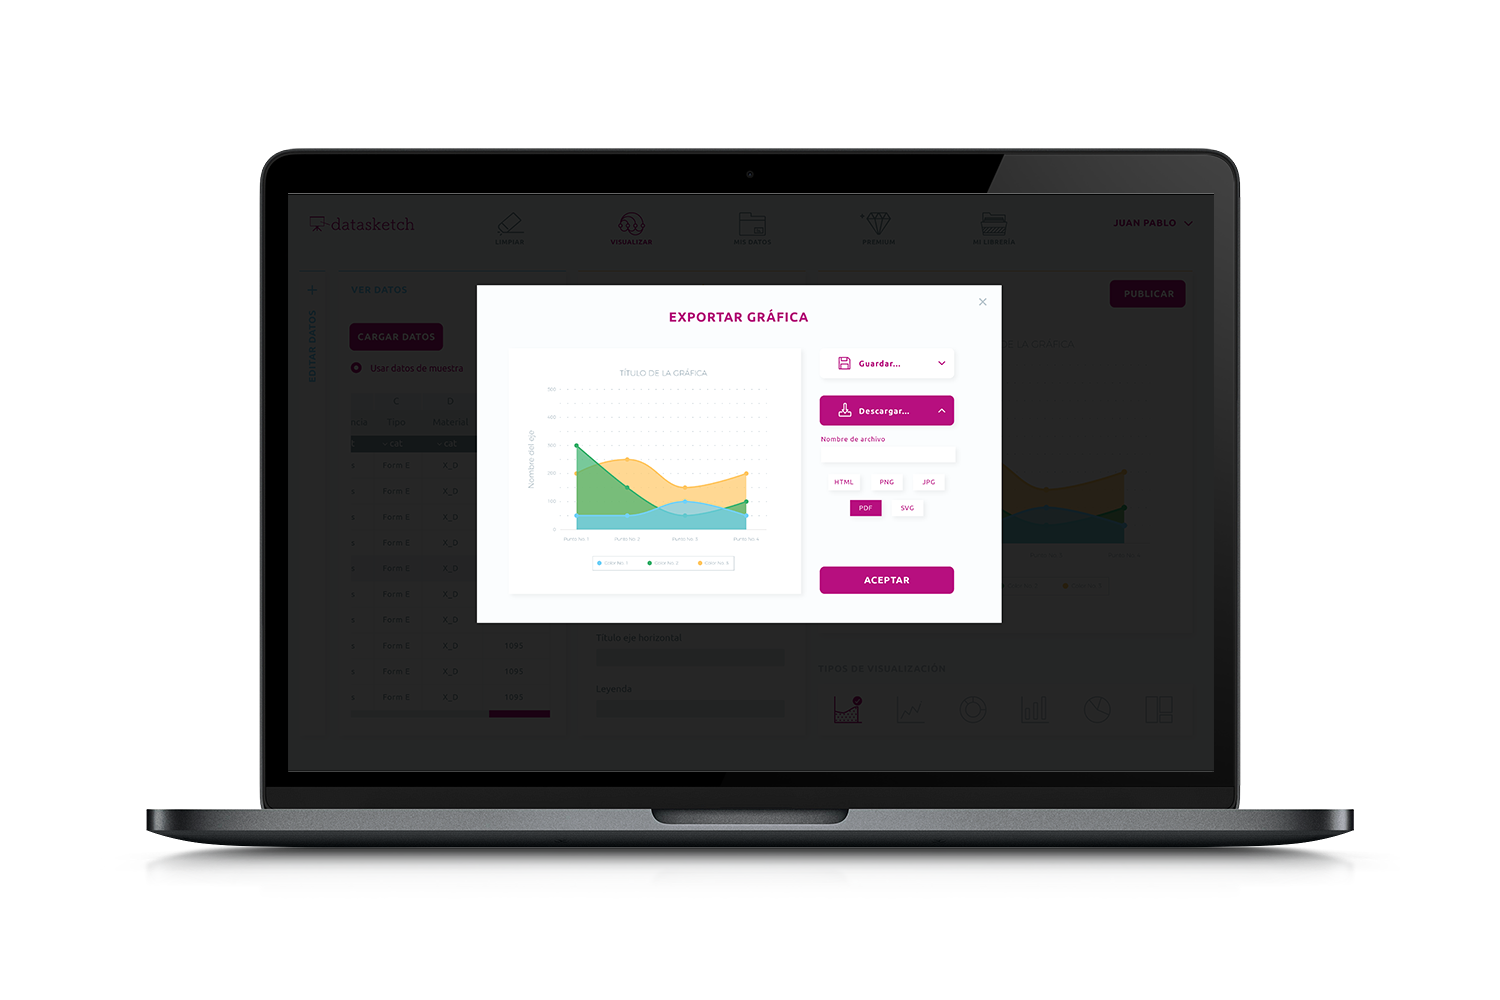
Export in multiple formats
You can export your data and visualizations in multiple formats, such as PDF, HTML, SVG, PNG or JPEG. You can use the exports to further tweak your visuals for offline use, for print or web deployment.
OUR TEAM

Juan Pablo Marín
Electronic engineer with a master's degree in Computational Statistics. Expert in Data Science with applications in multiple areas such as Economics, Hydrology and Journalism.

Camila Achuri
Statistics scientist and expert in R programming language. She has developed various applications of data visualization in transportation and Open Data subjects.

Juliana Galvis
Politologist and candidate for a master's degree in Digital Humanities. She is currently leading the development of the Who Is database, as well as supporting journalistic research and the creation of databases.

David Daza
Bachelor of Electronics. Expert in development of applications and websites with emphasis on data journalism and content management of multiple databases.

Verónica Toro
Anthropologist and researcher. Responsible for the management and organization of the data-community in Colombia and Latin America and provide support in journalistic investigations and the creation of databases.

Mariana Villamizar
Systems engineer and designer. Expert in user experience, data visualization and graphic communication. Feminist.

Lorena Cala
Industrial designer with experience and interest in the conception of ideas and communication measures for marketing, branding and design thinking.